MapMySections Guide#
This guide walks through our workflow developed for the Allen Institute MapMySections challenge.
Background: MapMySections
Webinar: Cell Type AZ Webinars
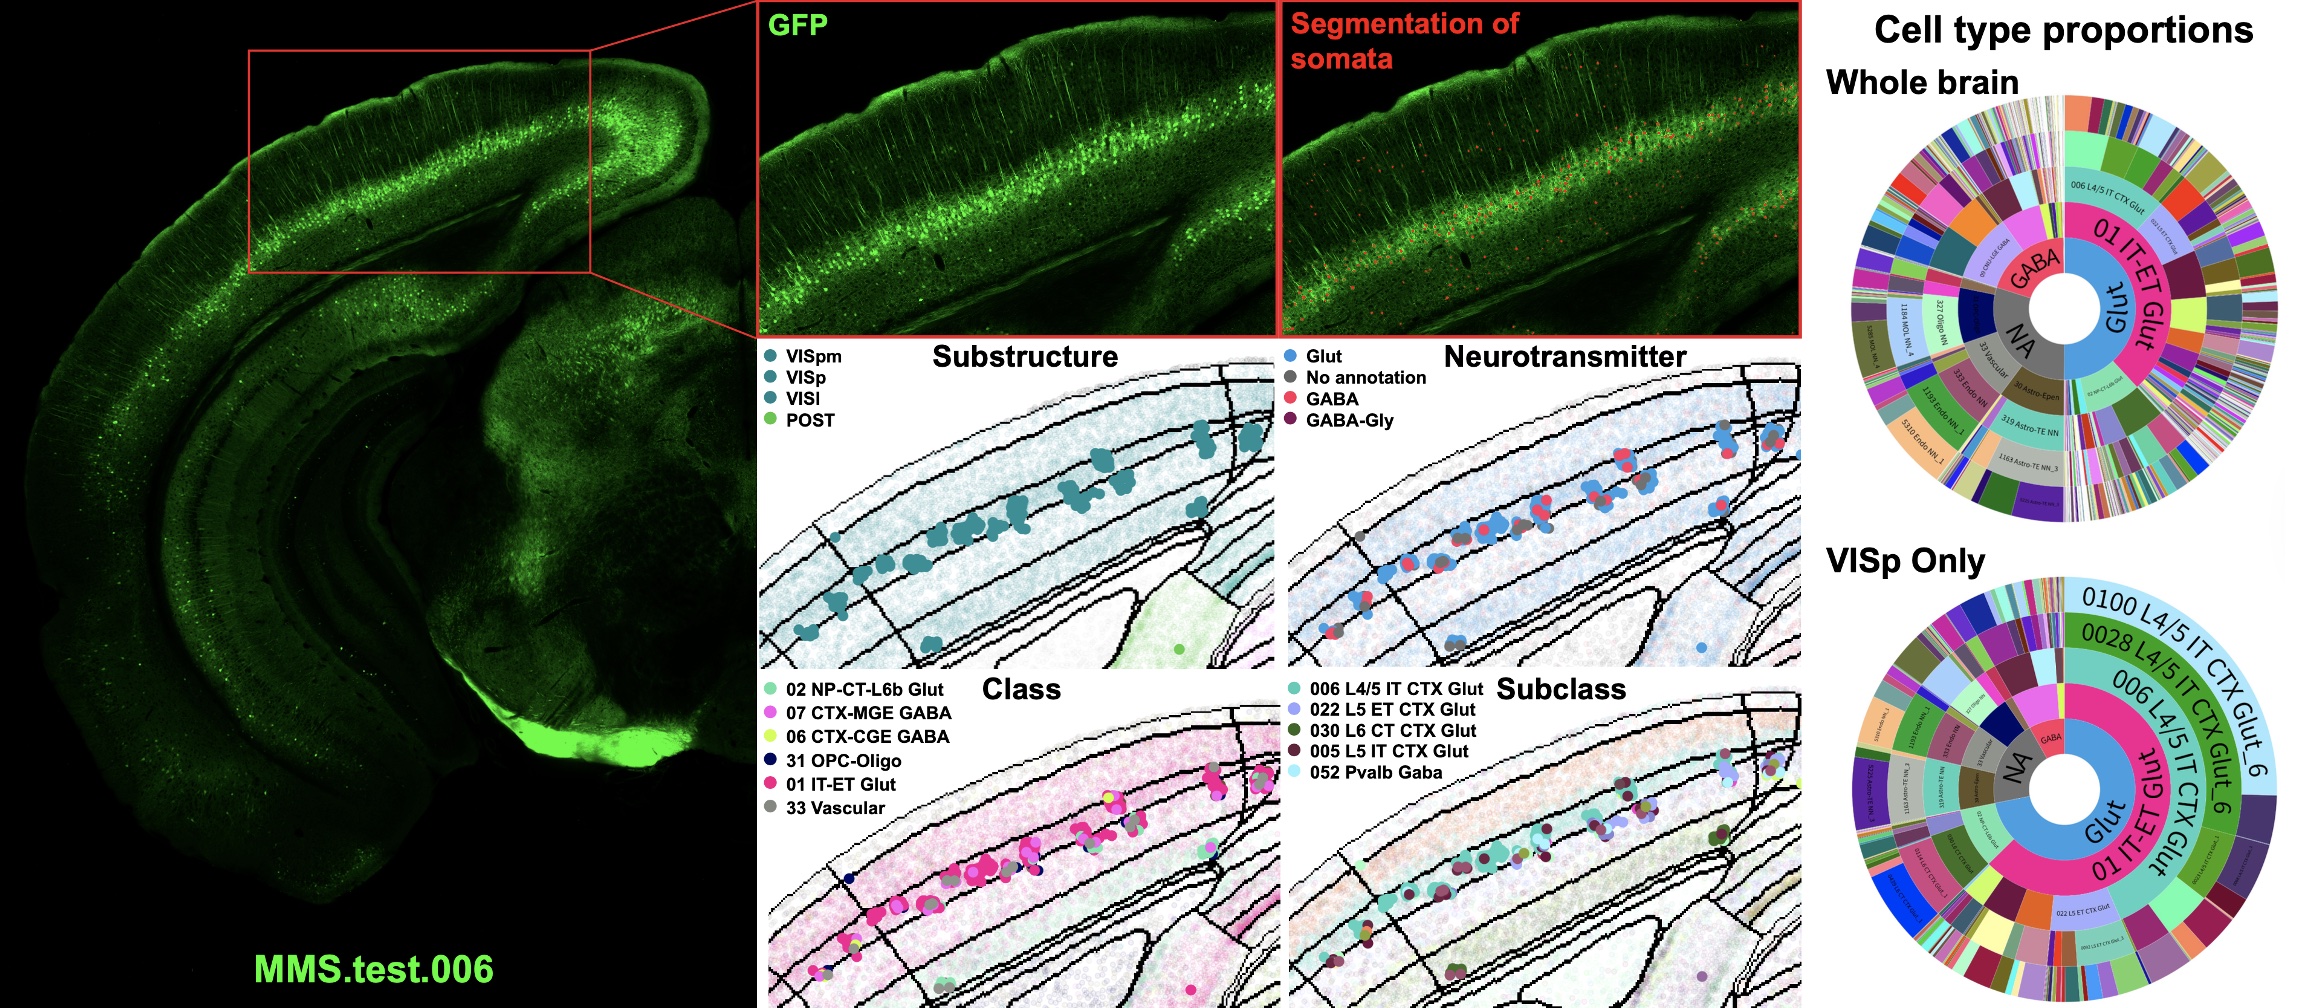
Example MapMySections results.#
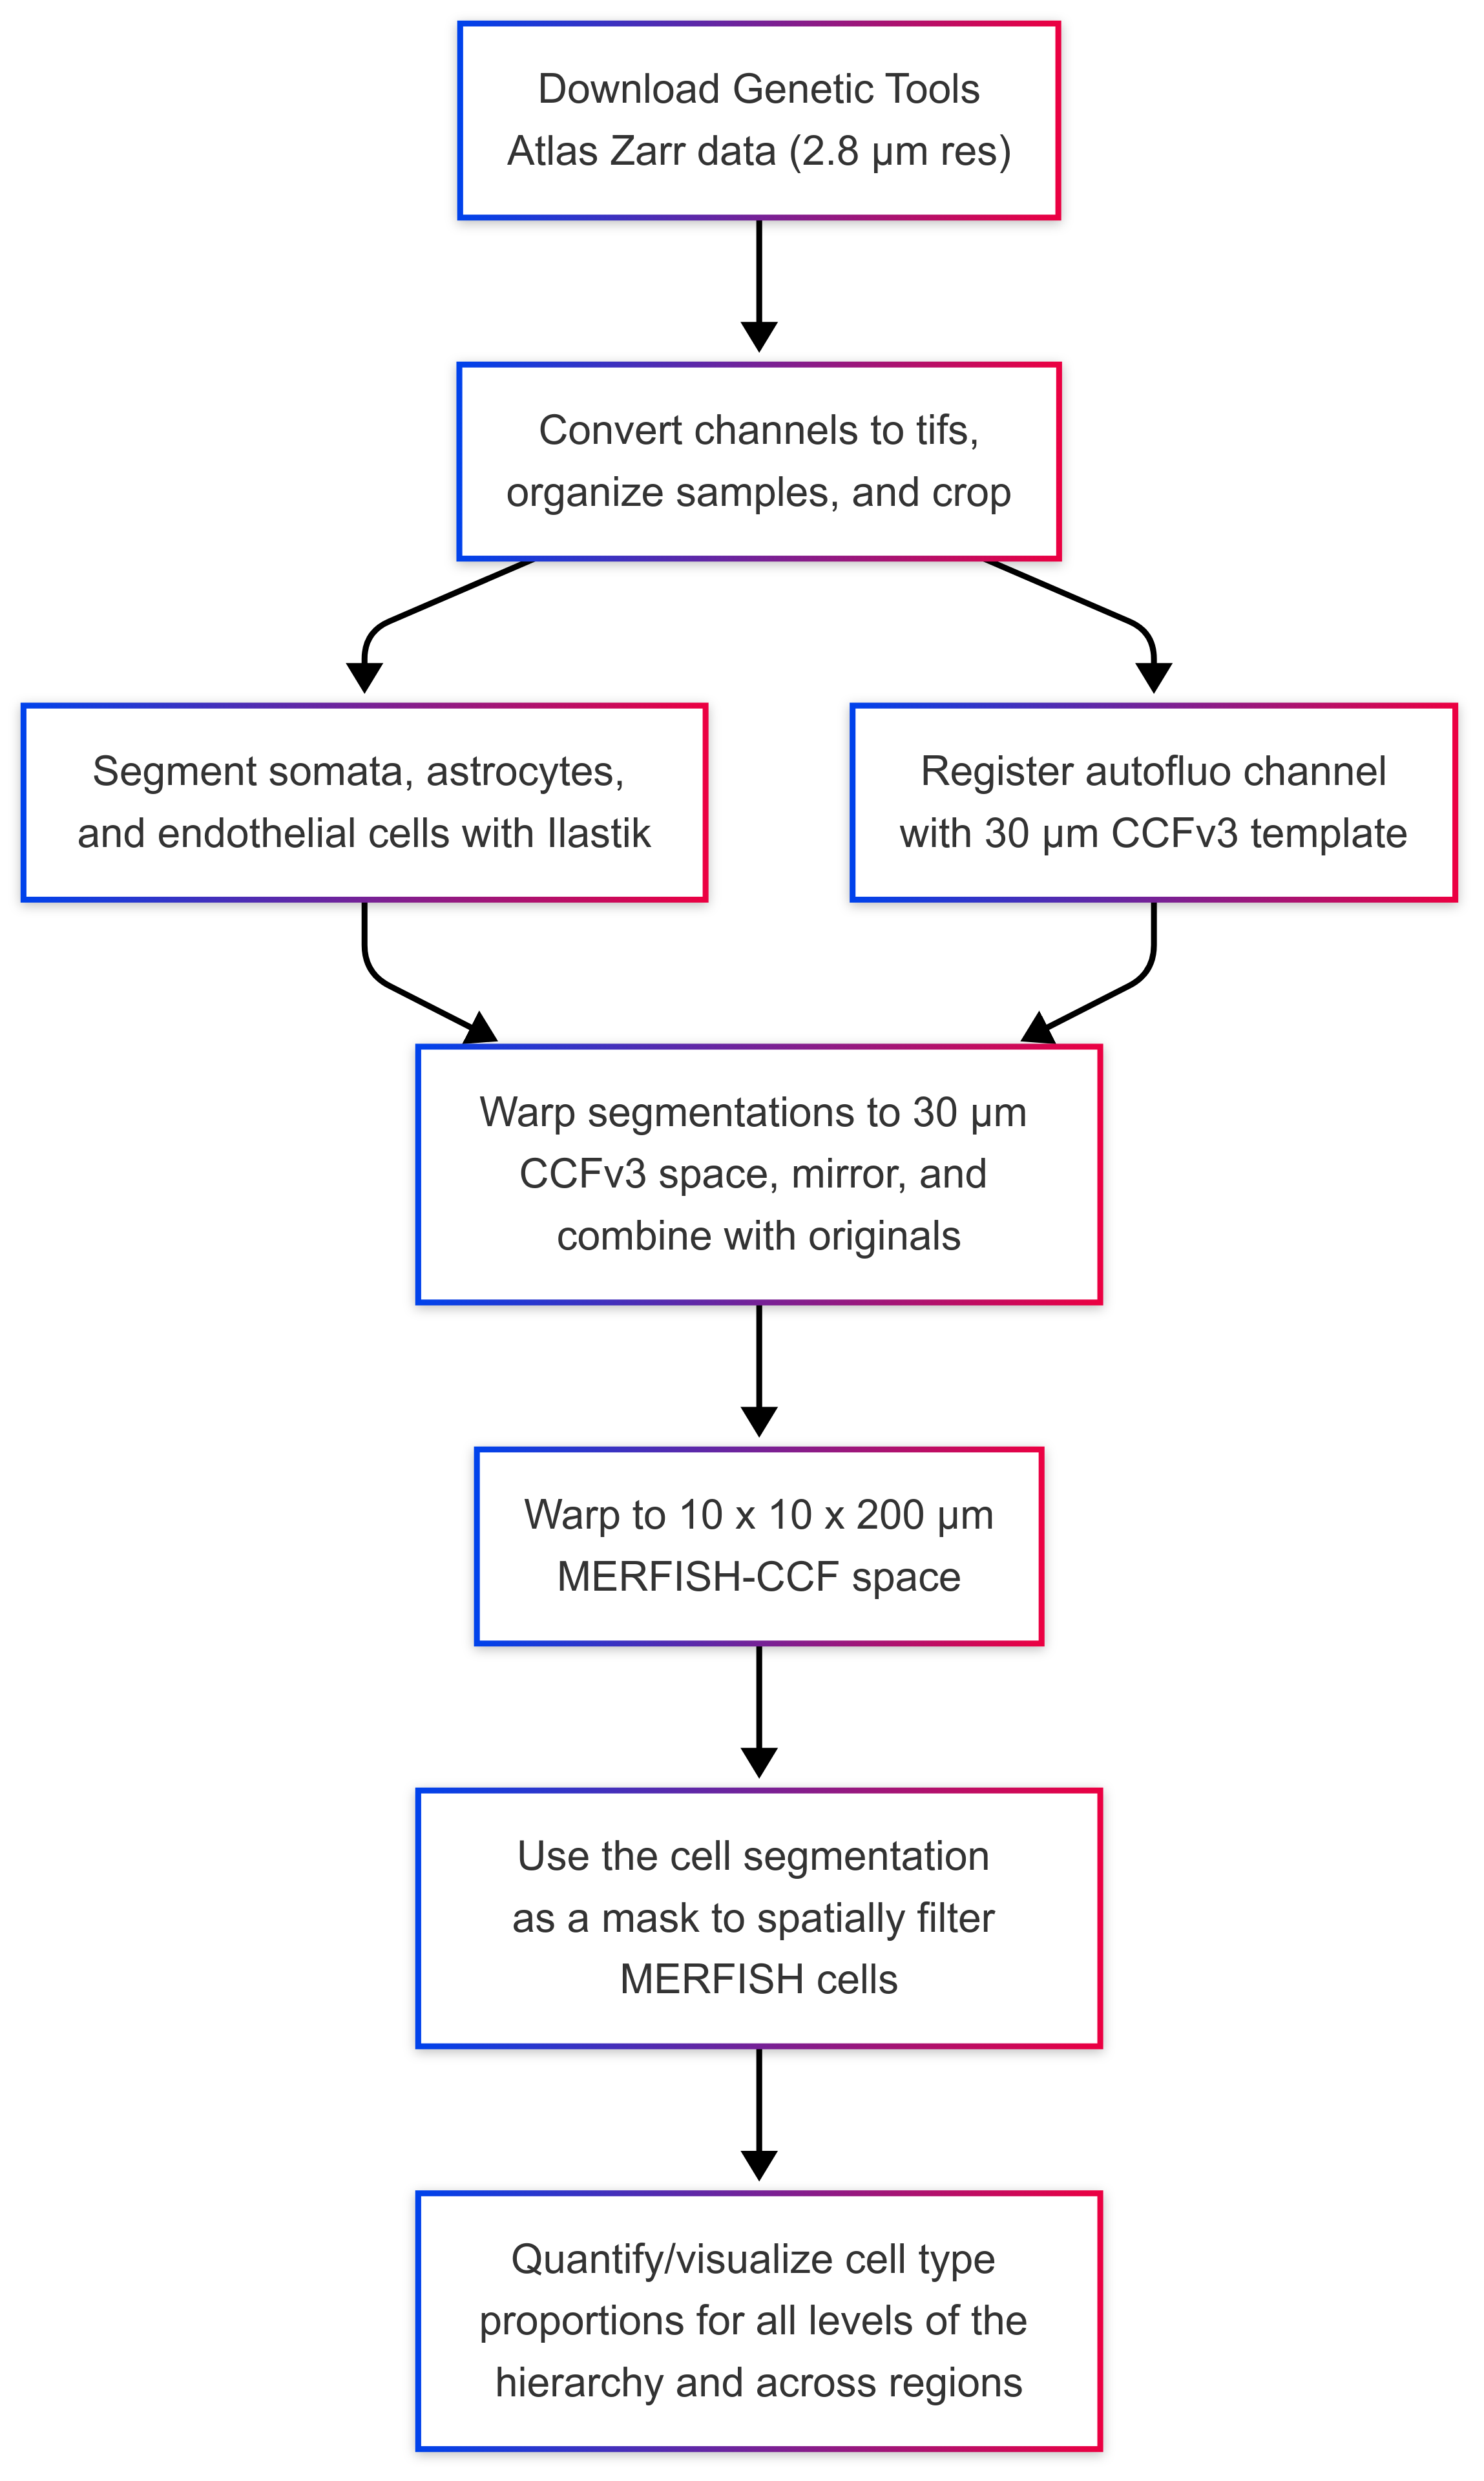
MapMySections workflow.#
Input Options
If you have your own LSFM/STPT images, skip ahead to the Segmentation section.
For more info, refer to our LSFM/STPT Guide.
Otherwise, download images from the Genetic Tools Atlas (GTA).
If needed, update
-p <sample folder pattern>and-d <path(s) to folder(s)>when running commands for batch processing of all brains.
Set Up#
To set up and activate a virtual environment, see the installation guide.
Installation with extra dependencies for using the Allen Brain Cell (ABCA) atlas cache:
cd <path/to/where/you/want/UNRAVEL>
git clone https://github.com/b-heifets/UNRAVEL.git
cd UNRAVEL
pip install -e .
pip install git+https://github.com/AllenInstitute/abc_atlas_access.git
Verify UNRAVEL commands are working
abca_cache -h # use <command> -h to view help for each command
Updating code
cd <path/to/UNRAVEL>
git pull
pip install -e .
cd -   # Return to prior working dir
Download ABCA metadata
cd <path/to/where/you/want/ABCA_download_root>
abca_cache -d MERFISH-C57BL6J-638850 MERFISH-C57BL6J-638850-CCF --dl_metadata
Save the ABCA_download_root path (e.g., required later for
abca_merfish_filter_by_mask).
Genetic Tools Atlas (GTA) Data#
cd </path/to/your/data or /path/to/where/you/want/GTA/data>
Visit the Genetic Tools Atlas (GTA)
Filter modality by STPT
Download metadata
Unzip it and move SpecimenMetadata.csv to the current working directory and optionally run:
gta_simplify_metadata # Outputs: SpecimenMetadata_subset.csv
Download Zarr Images#
# One experiment at resolution level 3
gta_download -e 1109210299 -l 3

# From metadata file
gta_download -c SpecimenFileManifest.csv -l 3 -col 'Image Series ID'

# From simplified metadata
gta_download -c SpecimenMetadata_subset.csv -l 3 -col 'Image Series ID'

# From MapMySections entrant dataset (first copy sheet to a csv)
gta_download -c MapMySections_EntrantData_Test_Set.csv -l 3 -col 'STPT Data File Path'
Output: GTA_level_3/*.zarr
GTA Zarr Image Resolution Levels
X & Y resolution levels are as follows:
0: 0.35 µm
1: 0.7 µm
2: 1.4 µm
3: 2.8 µm (good balance between resolution for segmentation vs. file sizes and processing speed)
4: 5.6 µm
5: 11.2 µm
6: 22.4 µm
7: 44.8 µm
8: 89.6 µm
9: 179.2 µm
Z resolution is always 100 µm.
Convert Zarr to TIFF#
cd GTA_level_3
conv -i '*.zarr' -s .tif -c 0 -o red
conv -i '*.zarr' -s .tif -c 1 -o green
rm -rf *.zarr  # optional
Organize TIFF directories into sample folders#
gta_org_samples
cd TIFFs
Optionally Crop Brains
# Adjust the channel (tif directory), threshold, and padding if needed
gta_auto_crop -d red -i green # Green channel cropping for samples with red labeling
gta_auto_crop -d green -i red
gta_auto_crop -d dual -i green # or -i red
Inspect brain outlines with Fiji, napari, or viu (this determines cropping)
agg -i 'bbox/*_aip_outline.tif' -td auto_crop_check -a -p 'ID_*' -d red green dual
cd auto_crop_check

# If viu and imagemagick are installed, quickly view images with:
for i in *.tif; do echo -e "\n$i"; magick "$i" -auto-level tmp.jpg && viu tmp.jpg && rm tmp.jpg; echo; done

cd ..
If cropping is satisfactory, apply cropping to the other channel (otherwise, adjust parameters for gta_auto_crop)
gta_bbox_crop -a green -i red -d red
gta_bbox_crop -a red -i green -d green
gta_bbox_crop -a green -i red -d dual # or -a red -i green
Remove uncropped TIFFs to save disk space and speed up processing
# If using bash, first run: shopt -s globstar
for d in red green dual ; do rm -rf $d/**/red/ $d/**/green/ ; done
Segmentation#
Install Ilastik & Download Pretrained Project#
Download project: Ilastik project folder
Training MMS sample IDs for input slices:
Astrocytes: 012, 021, 281
Endothelial: 067, 099, 183
Oligodendrocytes: 269, 359, 385
Rest: Neurons
Segment with Ilastik#
# Example (red channel)
seg_ilastik -ilp <path>/somata1_bkg2_endo3_astro4.ilp -i red -o MMS_seg -l 1 3 4 -rmo -v -p 'ID_*' -ie <path_to_ilastik_executable> -d red
Repeat for green or dual samples using the appropriate input channel
Executable locations:
Linux/WSL:
/usr/local/ilastik-1.4.0.post1-Linux/run_ilastik.shMac:
/Applications/ilastik-1.4.0.post1-OSX.app/Contents/ilastik-release/run_ilastik.shWindows:
C:\Program Files\ilastik-1.4.0.post1\run_ilastik.bat
If training from scratch, see this guide
Registration#
Download the template and atlas
# For STPT data use this template:
curl -L -o average_template_CCFv3_30um.nii.gz "https://drive.google.com/uc?export=download&id=13cdFNa8uG4zhR7mh6QZxPzJxhzYA8-vJ"

# For iDISCO/LSFM use this template:
curl -L -o iDISCO_template_CCFv3_30um.nii.gz "https://drive.google.com/uc?export=download&id=1BBg7ydj3WTfvbIqtBlrkkLiDl0ZmCeaP"

# Allen brain atlas (CCFv3; 30 µm resolution):
curl -L -o atlas_CCFv3_2020_30um.nii.gz "https://drive.google.com/uc?export=download&id=1IL0Qgi1ctJEM0Ask89l4CQqEj2RZWy7H"
Prep the fixed input for registration:
io_metadata -i green -x 2.8 -z 100 -p 'ID_*' -d red green dual
reg_prep -i green -p 'ID_*' -d red
reg_prep -i red -p 'ID_*' -d green

# for dual, use the channel with less fluorescence for -i. For example:
reg_prep -i green -p 'ID_*' -d dual
Run registration:
reg -m average_template_CCFv3_30um.nii.gz -f reg_inputs/autofl_50um.nii.gz -m2 atlas_CCFv3_2020_30um.nii.gz -mas None -sm 0.4 -ort RIA -v -p 'ID_*' -d red green dual
Check alignment:
reg_check -fri reg_outputs/autofl_50um_fixed_reg_input.nii.gz -p 'ID_*' -d red green dual

# Setting up fsleyes: https://b-heifets.github.io/UNRAVEL/guide.html#reg-check
cd reg_check
reg_check_fsleyes -fri '*autofl_50um_fixed_reg_input.nii.gz' -max 2000 &
cd ..

# If fsleyes is not working (e.g., on Windows), use ITK-SNAP or another neuroimaging viewer. Contact us about wireframe atlas coloring for ITK-SNAP.
Revising registration
# If registration is not good, try the other channel for affected samples
cd dual/ID_<enter number>
rm -rf reg_prep/ reg/
reg_prep -i red
cd ../../
# Rerun reg_prep, reg, etc.
Pre-Processing (CCFv3 Space)#
Warp segmentations to CCFv3 atlas space#
for i in 1 3 4 ; do warp_to_atlas -a atlas_CCFv3_2020_30um.nii.gz -i MMS_seg/MMS_seg_${i}.nii.gz -o MMS_seg_${i}.nii.gz -dt uint8 -fri reg_outputs/autofl_50um_fixed_reg_input.nii.gz -inp nearestNeighbor -zo 0 -v -p 'ID_*' -d red green dual ; done

agg -i 'atlas_space/MMS_seg_*.nii.gz' -a -td CCF30_space -p 'ID_*' -d red green dual

cd CCF30_space
Oligodendocytes check#
Determine the prevalence of voxels segmented as oligodentrocyte somata in the anterior commissure
mms_soma_ratio -a <path>/atlas_CCFv3_2020_30um.nii.gz
cd soma_ratio
mms_concat_with_source
# The concatenated_output.csv can be used later to revise cell type proportions.
# For example, if the proportion of somatic voxels in the anterior commissure is greater than 0.004, then labeling is likely occurring in oligodendrocytes.
cd ..
Prep seg images for warping to MERFISH space#
Mirror segmentation masks:
mirror -o mirrored -i '*1.nii.gz'
Combine with the original
for i in *1.nii.gz ; do img_math -i $i mirrored/mirror_${i} -o combined/$i -n + -t 0.5 -d uint8 -r $i & done

cd combined
Warp to MERFISH space#
Download warp files (CCF30_to_MERFISH.tar.gz) here (This is 1.4 GB)
Extract it (double click or use tar -xvzf CCF30_to_MERFISH.tar.gz). This is the warp root.
Warp combined segmentation images from CCFv3 space (30 µm res) to MERFISH space:
warp_ccf30_to_merfish -i '*.nii.gz' -w </path/to/warp_root>

cd MERFISH
Spatially Filter MERFISH Cells#
abca_merfish_filter_by_mask -i '*.nii.gz' -b <ABCA_download_root> -o cells

cd cells

# Optionally remove non-neuronal cells
for i in *.csv ; do abca_merfish_filter -b <ABCA_download_root> --neurons -i $i ; done
Visualize Cell-Type Proportions#
For all cells across the brain:#
abca_sunburst -i ID_1104197092_MMS_seg_1_MERFISH_cells.csv -l
Make a sunburst plot, as described here, except update Data and Preview settings:
Under Data: set Categories/nesting to A-E and Size by B.
Under Preview –> Colors –> Custom overrides, paste the contents of WMB_sunburst_colors.csv
Copy columns from ID_1104197092_MMS_seg_1_MERFISH_cells_sunburst.csv into Data
Switch to the Preview tab
Wider pie angles = larger cell type proportions
Inner ring = neurotransmitter level, followed by class, subclass, supertype, and cluster
Use Hierarchy –> Depth to adjust how many rings are shown
For region-specific filtering & visualization:#
abca_merfish_filter -b $A -i ID_1104197092_MMS_seg_1_MERFISH_cells.csv -val ACB
abca_sunburst -i ID_1104197092_MMS_seg_1_MERFISH_cells_filtered_ACB.csv
Quantify cell type proportions#
For a region (e.g., VISp):
mms_cell_type_proportions -i '*.csv' -col subclass -rc parcellation_structure -r VISp -t
For the whole brain:
mms_cell_type_proportions -i '*.csv' -col subclass -t
Outputs from mms_cell_type_proportions have one row with cell type proportions per brain.
To combine them into one csv, run:
mms_cell_type_proportions_concat

# Optional: --keep_list <path/keep_cell_type_columns.txt> may be used match columns in the challenge (see help for notes).
Revising cell type proportions#
Summarize relative proportions of voxel counts for each segmentation label (somata, endothelial, astroglial)
cd ../../../.. # cd to the TIFFs dir
mms_seg_summary -d red green dual
agg -i 'MMS_seg/MMS_test_*_segmentation_summary.csv' -td seg_summary -p 'ID_*' -d red green dual
cd seg_summary
mms_concat_with_source  # Combine outputs into one file (one row per brain)
cd ..
Revise cell type proportions
If the majority of voxels are endothelial, this brain is likely enriched for endothelial cell labeling.
If the majority of voxels are astroglial, this brain is likely enriched for astroglial labeling.
If the proportion of somatic voxels in the anterior commissure is > 0.004 in concatenated_output.csv, this brain is enriched for oligodendrocyte labeling.
Gene Expression Across Cell Types#
For gene expression sunburst plots:
abca_merfish_join_gene -b $A -i ID_1104197092_MMS_seg_1_MERFISH_cells_filtered_ACB.csv -g Drd2
abca_sunburst_expression -i ID_1104197092_MMS_seg_1_MERFISH_cells_filtered_ACB_Drd2_expression.csv -g Drd2
abca_mean_expression_color_scale
Copy the ID_1104197092_MMS_seg_1_MERFISH_cells_filtered_ACB.csv contents into the Data tab as before.
Open the <…>_mean_expression_lut.txt and copy it into the Preview –> Colors –> Custom overrides